OpenStack Horizon is a web based interface for managing OpenStack clouds. Just like many other OpenStack components, it's implemented in Python and uses the Django framework.
Sometimes you might notice that Horizon is sluggish and slow and it's not obvious what causes this. Natural thing to do in this case is to profile it to see problematic points.
There are at least two possible ways to profile that:
- Use osprofiler, an "official" OpenStack Profiler,
- Use standard Python profiling facilities like cProfile.
I recommend using the latter and I'll elaborate on that a little later.
Preparation
I think it's a good idea to profile Horizon in the same environment where you run your stage Horizon, i.e. pick one of the nodes where you have Horizon installed already (e.g. configured to be served using Apache) and bring your own instance of Horizon with the same configuration, but on a different port and using Django's built in http server.
For that purpose, you can copy over Horizon sources somewhere to your home directory (either an appropriate branch from git, or maybe grab sources from the package you use, that depends on your processes), copy over the existing config files (e.g. local_settings.py) and from top level source directory of horizon run:
~/horizon$ ./manage.py runserver 0.0.0.0:8000
This way your brand new Horizon instance will be available on port 8000. Also, you might want to check iptables configuration that it actually allows connections to this port.
Note: We're not using virtualenv because as we're running this on a Horizon node, we have all the dependencies installed via system packages.
Once this instance becomes accessible, we can start actual debugging.
Profiling
There's a wonderful Django Extensions package that makes Django profiling very easy. That could be installed via packages, e.g. on Ubuntu you can do:
# apt-get install python-django-extensions
It could be installed using pip too in case your distro misses this package:
# pip install django-extensions
After installing the package, it's required to include it to the Horizon's INSTALLED_APPS list. While in the local copy of Horizon, open openstack_dashboard/settings.py, find INSTALLED_APPS and add 'django_extensions' to this list. The resulting setting should look something like this:
INSTALLED_APPS = [
    'openstack_dashboard',
    'sbr_reports',
    'sbr_log_processing',
    'django.contrib.contenttypes',
    'django.contrib.auth',
    'django.contrib.sessions',
    'django.contrib.messages',
    'django.contrib.staticfiles',
    'django.contrib.humanize',
    'django_pyscss',
    'openstack_dashboard.django_pyscss_fix',
    'compressor',
    'horizon',
    'openstack_auth',
    'django_extensions', #  for runprofileserver
]
Now it's possible to run the profile server. Terminate the old 'runserver' that was used to test basic configuration, create a directory for the profiling data and start the profiling server:
$ mkdir ~/horizon_profile_data_001
$ ./manage.py runprofileserver --use-cprofile --prof-path=/home/user/horizon_profile_data_001 0.0.0.0:8000
Note: looks like --prof-path doesn't decode "~", so have to pass the full path.
Now Horizon is running in profiling mode, so we can open it up in the browser and navigate to the problematic pages, for example "Admin -> System -> Networks".
Analyzing Results
If everything went file, in ~/horizon_profile_data_001 you'll see something like this:
~/horizon_profile_data_001$ ls |grep networks
admin.networks.001278ms.1495361937.prof
~/horizon_profile_data_001$
Now we can use the pstats module to analyze the results:
python -m pstats admin.networks.001278ms.1495361937.prof
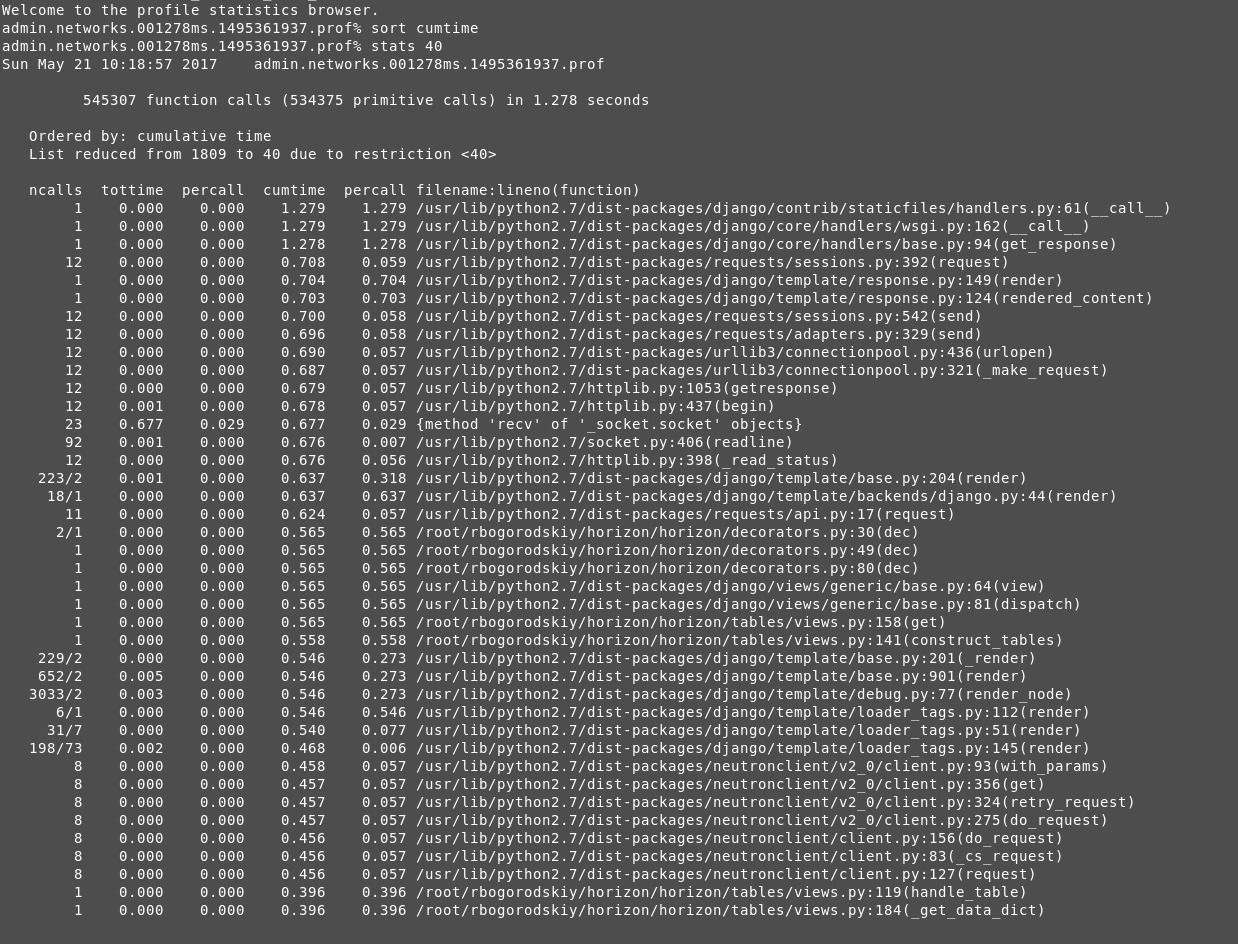
This opens an interactive interface for exploring profiling data. If you're not familiar with that, a good start would be to do:
sort cumtime
stats 40
Here's how it looks for me:
Here you can get an idea how much time was spent in template rendering, Neutron client, etc.
Why not osprofiler
- osprofiler only traces calls that were decorated with the profiler decorator (example). This means that if some function was not decorated, either intentionally or by mistake, you will not get details about it,
- It uses JSON-formatted results, but I wasn't able to find a schema or documentation on it,
- Its CLI is non-intuitive. Specifically, it provides osprofiler trace show command (as per docs), but there's no osprofiler trace list or other command to list traces,
- It requires to have Mongo installation and therefore is harder to configure,
Also, the documentation stats that osprofiler is different from cProfile in a way that it skips random Python calls, however, it's not hard to strip those from the .prof file (but why would you need to do that though?), and it doesn't look like an advantage to me. Maybe it makes more sense for profiling components like Nova or Neutron though.

This comment has been removed by a blog administrator.
ReplyDeleteFound some more good interesting articles to help you...
ReplyDeleteTechnical Blogs
OpenStack free linux training
Linux free training online
Devops Free online tutorials
Puppet Free tutorials online
> It requires to have Mongo installation and therefore is harder to configure,
ReplyDeleteosprofiler can use a few other backends (e.g. sqlalchemy or an amqp queue): https://github.com/openstack/osprofiler/tree/master/osprofiler/drivers
This comment has been removed by the author.
ReplyDelete